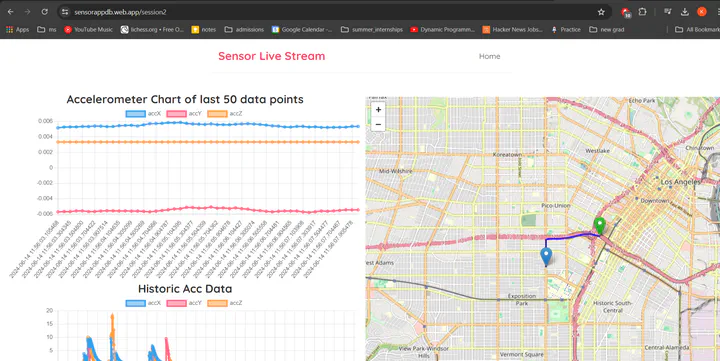
Sensor Data Visualization and Streaming
Jun 19, 2023· ,·
2 min read
Kshitij Pawar
Ted
 Image credit: Unsplash
Table of Contents
Sensor Data Visualization and Streaming
Website hosted on Firebase
Motivation
A data collection application which can be used to record sensors and GPS onboard smartphones for smart visualization and detection of anomalies or events
Overview
This project comprises two applications:
- Flutter Mobile App: A mobile application built using Flutter to monitor and record sensor data (accelerometer and gyroscope) and stream it to Firebase Realtime Database.
- React JS Web App: A web application built using React JS to view and chart the recorded sensor data from Firebase Realtime Database.
Flutter Mobile App
Features
Sensor Data Visualization:
- One screen displays the accelerometer and gyroscope data.
- Data is charted using a custom painter class for dynamic visualization.

Data Recording and Streaming:
- Records sensor values (accelerometer and gyroscope).
- Streams the recorded data to Firebase Realtime Database in real-time.


Images
Installation and Setup
Clone the Repository:
git clone https://github.com/Kshitijpawar/Sensors-App.git
cd Sensors-App/flutter-sensors-app
Install Dependencies:
flutter pub getRun the App:
flutter run
Configuration
- Ensure you have the correct Firebase configuration in
lib/firebase_options.dart. You can create one on Firebase console for free. - Update your
pubspec.yamlfile with necessary dependencies.
React JS Web App
Features
- Data Visualization:
- Reads accelerometer and gyroscope data from Firebase Realtime Database.
- Uses Chart.js to visualize the recorded sensor data in real-time.


Installation and Setup
Clone the Repository:
git clone https://github.com/Kshitijpawar/Sensors-App.git
cd Sensors-App/react-webapp
Install Dependencies:
npm installRun the App:
npm start
Configuration
- Ensure you have the correct Firebase configuration in
src/FirebaseSettings.js.
Future To-Dos
Enhance Mobile App:
- Add more sensors and data visualization screens.
- Implement offline data storage and sync when the network is available.
Improve Web App:
- Add user authentication for secure data access.
- Implement data export functionality (CSV, Excel).
- Enhance data visualization with more chart options and customization.
General Improvements:
- Optimize data streaming and database interactions.
- Improve the user interface and user experience across both apps.
- Conduct extensive testing and bug fixing.
Contributing
Contributions are welcome! Please fork this repository and submit pull requests.
License
See the LICENSE file for details.
Contact
For any queries or suggestions, please contact kshitijvijay271199@gmail.com.